International Activities Program Highlights - PISA
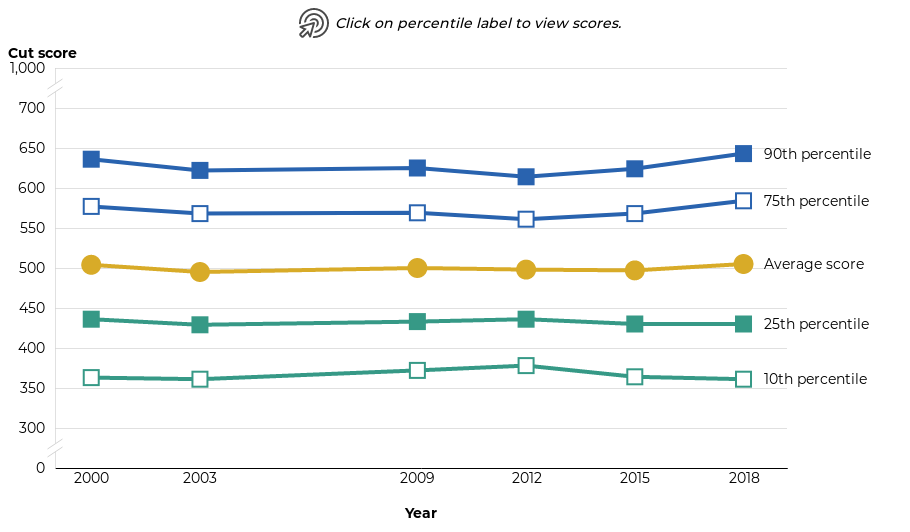
Explore how U.S. 8th grade students computer and information literacy and computational thinking compared internationally in 2018.
 https://nces.ed.gov/surveys/pisa
Background (via https://nces.ed.gov/surveys/pisa/)
The Program for International Student Assessment (PISA) is an international assessment that measures 15-year-old students’ reading, mathematics, and science literacy every three years. First conducted in 2000, the major domain of study rotates between reading, mathematics, and science in each cycle. PISA also includes measures of general or cross-curricular competencies, such as collaborative problem solving. By design, PISA emphasizes functional skills that students have acquired as they near the end of compulsory schooling. PISA is coordinated by the Organization for Economic Cooperation and Development (OECD), an intergovernmental organization of industrialized countries, and is conducted in the United States by NCES. Data collection for the most recent assessment was completed in Fall 2018.
PISA 2018 assessed students’science, reading, and mathematics literacy in about 80 countries and education systems. Reading was the focal subject of the 2018 data collection, as it was in 2009. PISA 2018 also included the optional assessment of financial literacy which the United States administered. Data from the core 2018 reading, mathematics, and science literacy assessment are now available. Data for financial literacy will be released in spring 2020.
The most recent PISA results are from 2018 and are available here. More information about PISA and resources, including the OECD’s PISA reports, PISA assessment frameworks, and international data files, are available at the OECD’s website.
Development
For this project I acted as data and visualization specialist on a team of designers, web developers, and content area experts to produce this summary release for the National Center for Education Statistics website. The PISA summary release is designed to assist the general public in better understanding the most recent results of national and international surveys, embedded with static and interactive visualizations.
Software
- R: Data cleaning and json production
- D3.js: Visualization