International Activities Program Highlights
Explore how US 8th grade students computer and information literacy and computational thinking compared internationally in 2018.
 https://nces.ed.gov/surveys/talis
Background
The Teaching and Learning International Survey (TALIS) is a survey about teachers, teaching, and learning environments. Sponsored by the Organization for Economic Cooperation and Development (OECD), TALIS is composed of two questionnaires—one for teachers and one for their principals—which ask questions about their backgrounds, their work environments, professional development, and their beliefs and attitudes about teaching. TALIS is unique because it is the only comparative international education study that collects data on nationally representative samples of teachers. For the United States, TALIS provides key information on teachers and principals and how they and their working and learning environments compare internationally.
The core target population in TALIS is ISCED level 2 (lower secondary) teachers and school principals. ISCED level 2 corresponds to grades 7, 8, and 9 in the United States. Education systems also have the option to survey at the ISCED level 1 (primary) or ISCED level 3 (upper secondary). However, the United States and most other education systems only participate at the lower secondary level.
TALIS was first administered in 2008 and then in 2013 and 2018. The United States first participated in the 2013 cycle, along with 37 other education systems. The most recent round of data collection was in 2018, with 49 education systems participating. U.S. results for the 2018 administration of TALIS are available on the TALIS 2018 Results page. Full results from all three rounds of TALIS are available on the OECD TALIS website.
Development
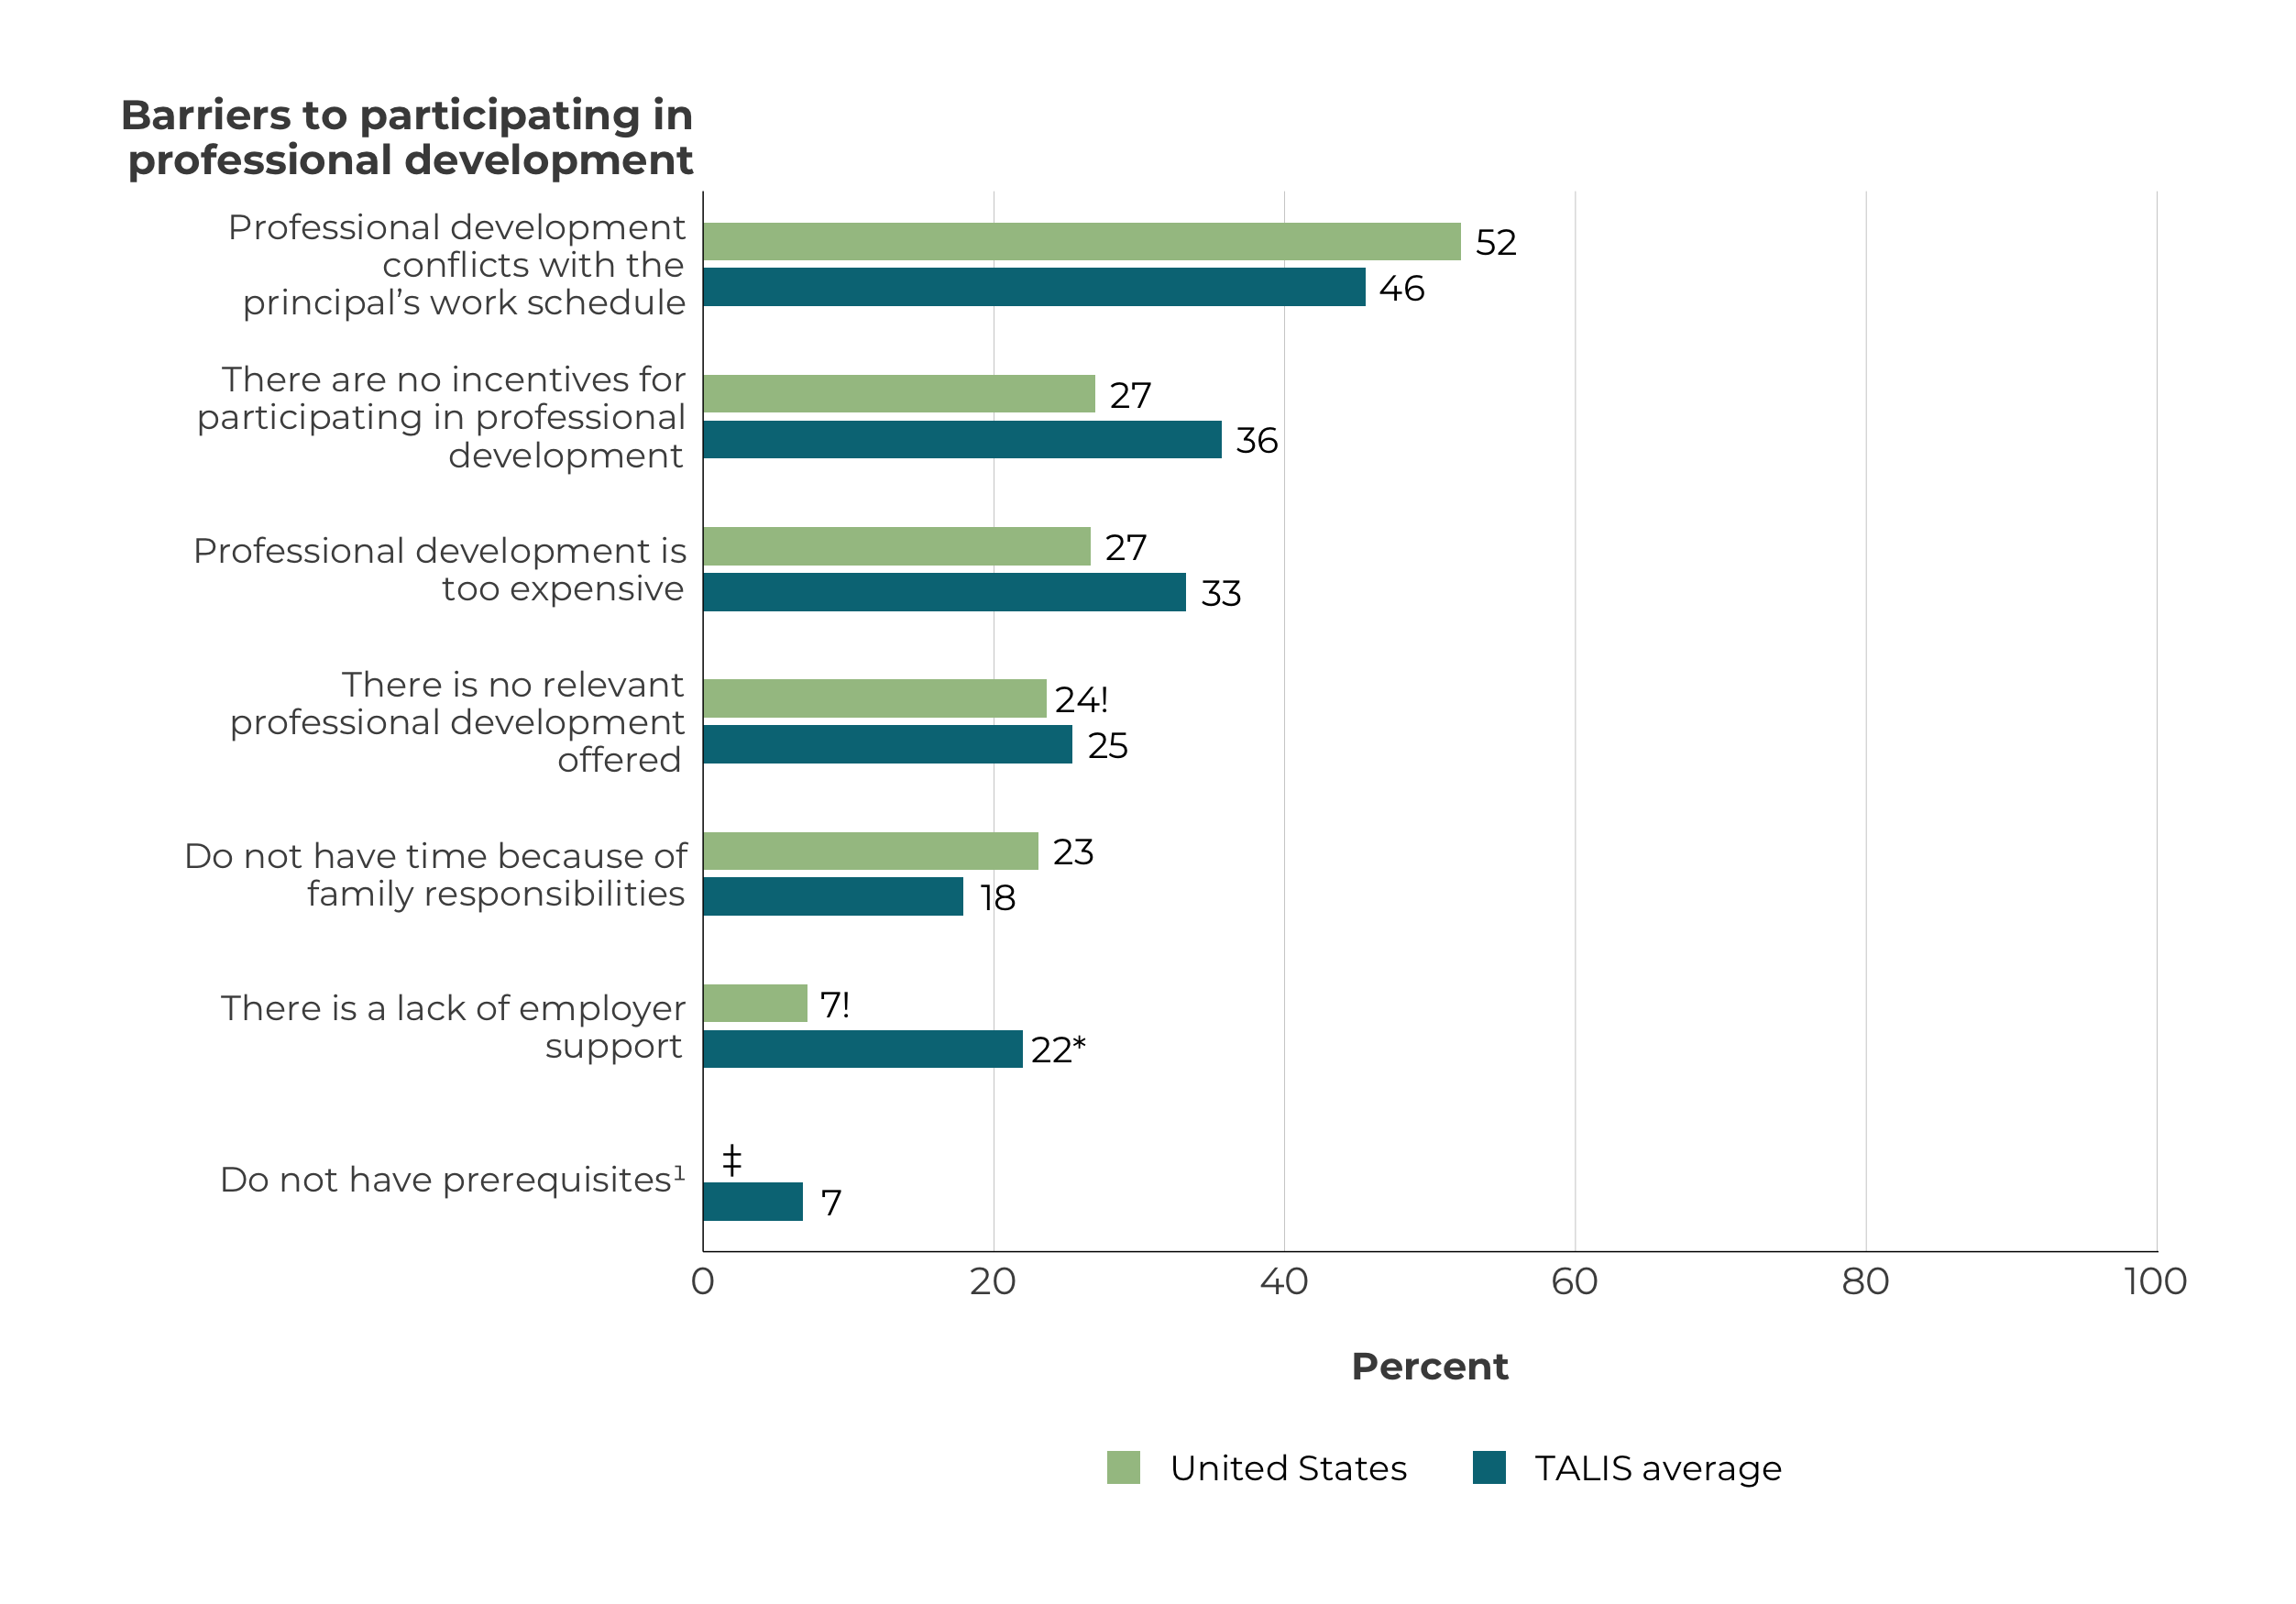
For this project I acted as data and visualization specialist on a team of designers, web developers, and content area experts to produce this summary release for the National Center for Education Statistics website. The TALIS summary release is designed to assist the general public in better understanding the most recent results of national and international surveys, embedded with static and interactive visualizations.
Software
- R: Data cleaning, json production, and visualizations