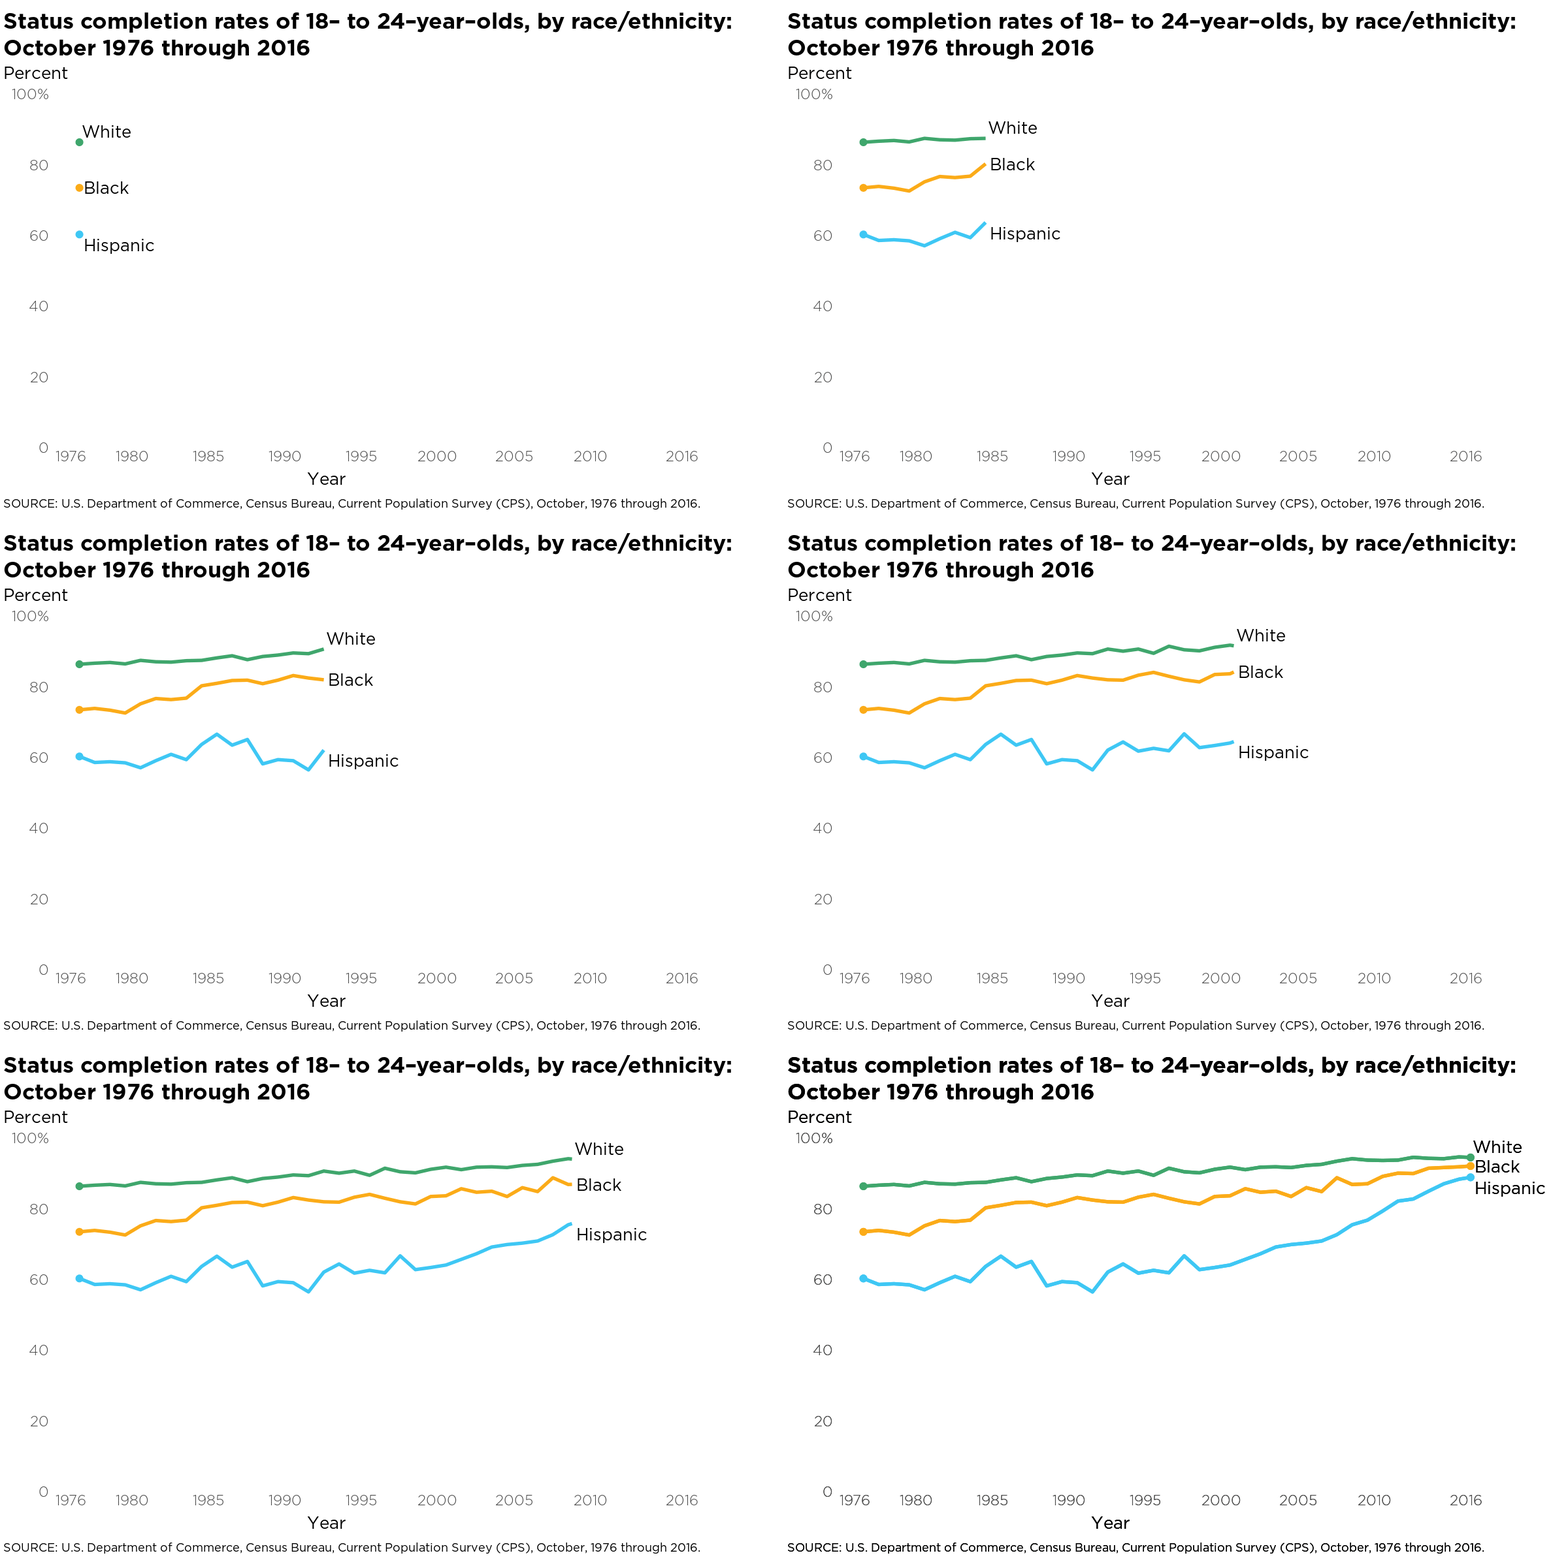
Line Chart - Status Completion Rate
Status completion rates of 18 to 24 year olds, by race/ethnicity: October 1976 through 2016
Animation seen here:
JUST RELEASED! Explore our new report to learn animation \#HighSchool status completion rates of 18-to 24-yr-olds by race/ethnicity over the past 40 years! Find more \#EdTrends here: https://t.co/OkOs6B7tnC pic.twitter.com/m2U9FvIW1c
— NCES (@EdNCES) December 12, 2018
Full image:

Interested in learning more? Hire me to consult on your next project, follow me on twitter, or contact me via email. All inquiries welcome!