🌚 Dark
🌝 Light
← Home
Projects
2022
EdSurvey: A User's Guide Book
Web book and user's manual for the EdSurvey R package.
R
research
education
book
edsurvey
bookdown
2022
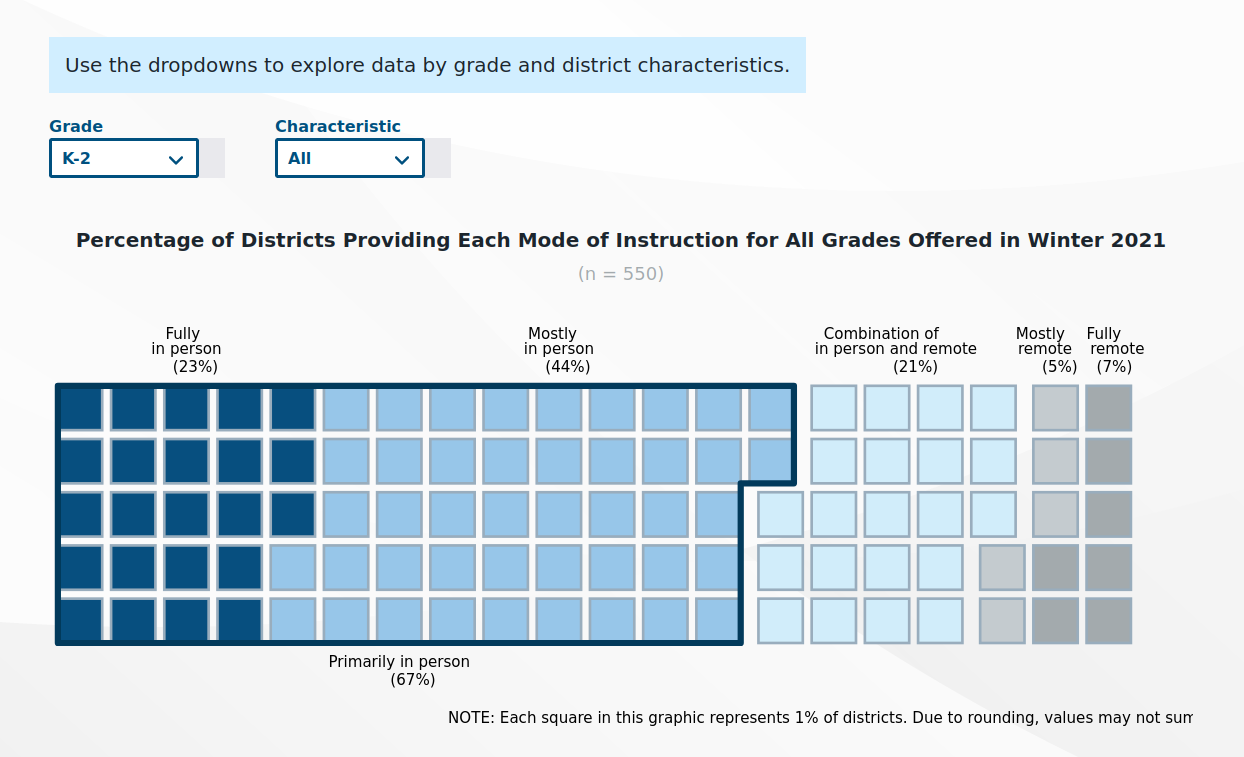
PERC Covid Data Story
A data story from the National Survey of Public Education's Response to COVID-19.
ggplot2
R
research
data visualization
education
data
perc
covid
2021
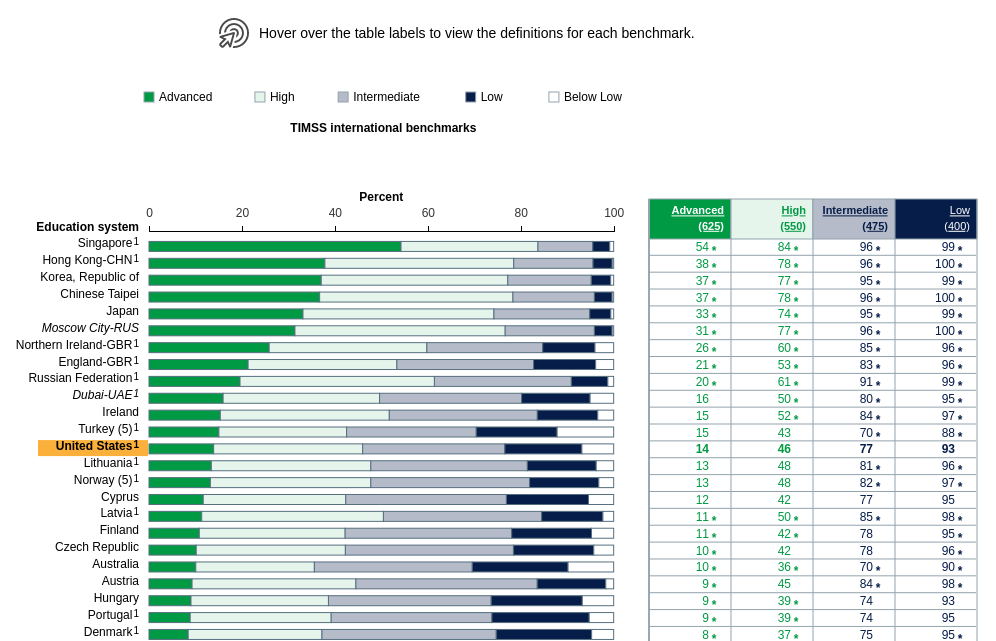
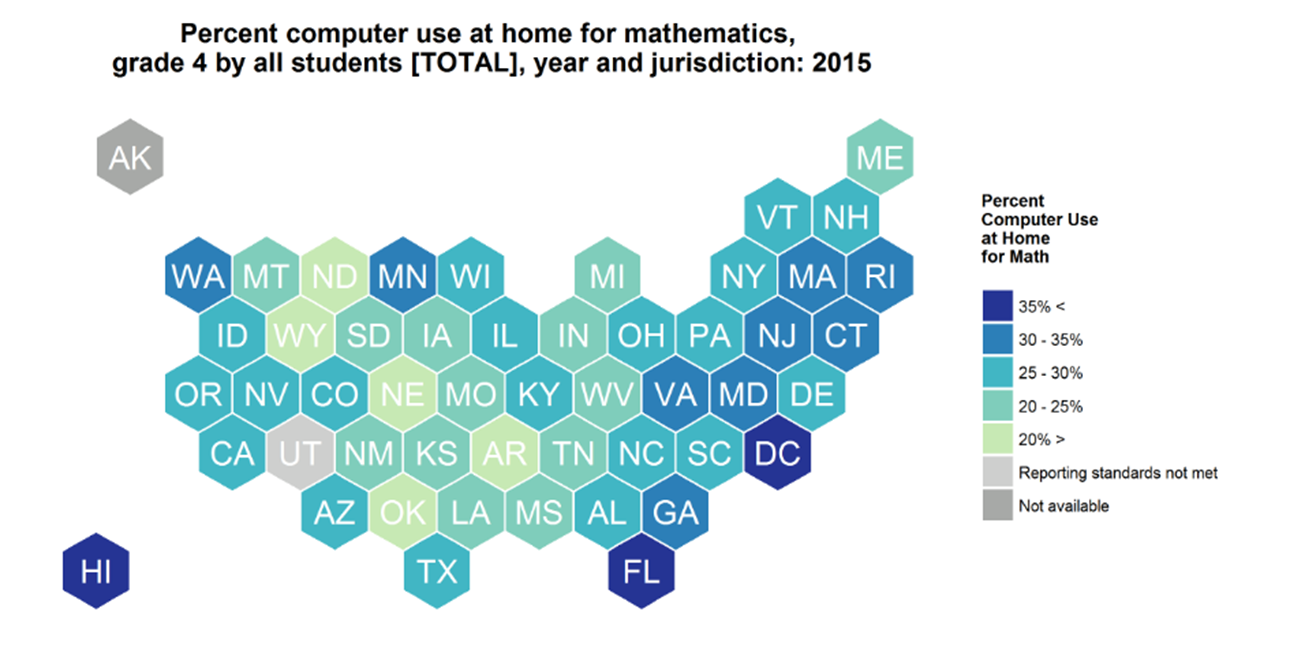
International Activities Program Highlights - TIMSS
Explore how U.S. 8th grade students computer and information literacy and computational thinking compared internationally in 2018.
D3.js
R
research
education
data
timss
iap
2020
NCES Social Media Outreach - Animation
Broadcast and disseminate the education-related data of the center to the public through the use of animation.
R
research
education
data
2019
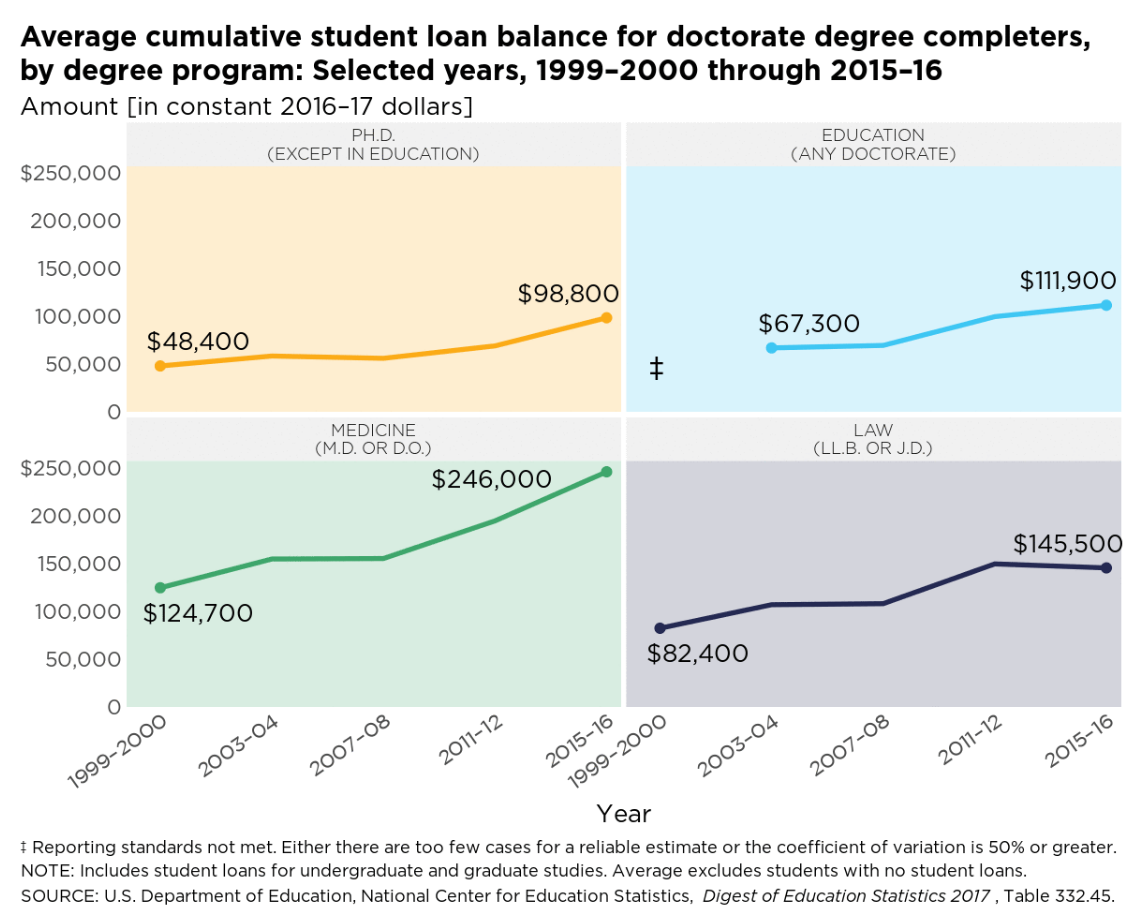
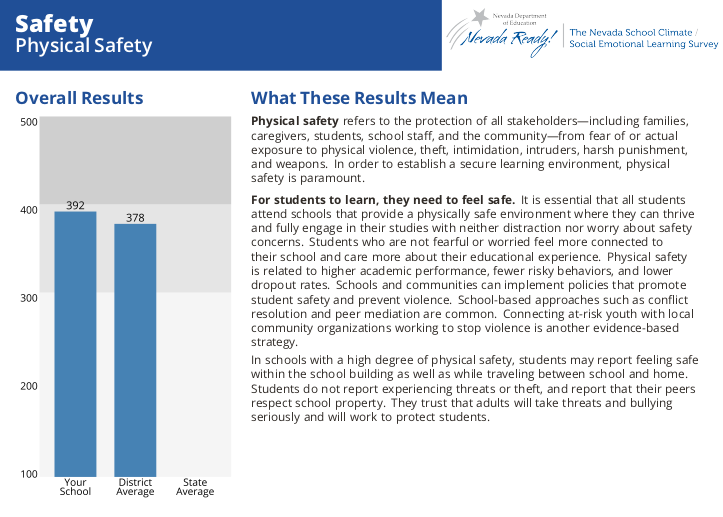
Automated Reports - Nevada Department of Education
Automate the production of over 700 reports embedded with customized text, tables, visualizations, and 508 compliance tags.
LaTeX
R
ggplot2
education
automated reports
508 compliance
2019
International Activities Program Highlights - PISA
Explore how U.S. 8th grade students computer and information literacy and computational thinking compared internationally in 2018.
D3.js
R
research
education
data
pisa
iap
2019
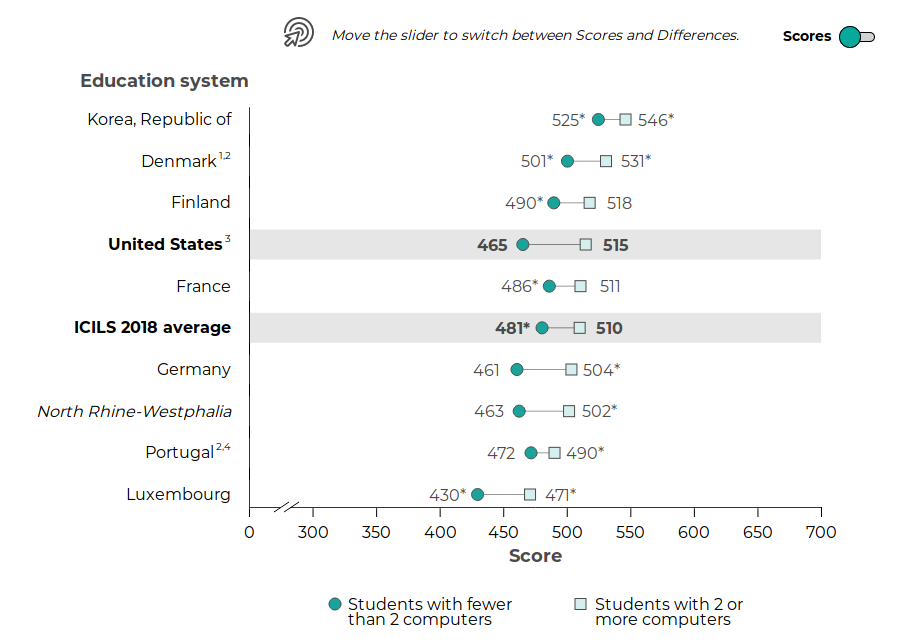
International Activities Program Highlights - ICILS
Explore how U.S. 8th grade students computer and information literacy and computational thinking compared internationally in 2018.
D3.js
R
research
education
data
icils
iap
2019
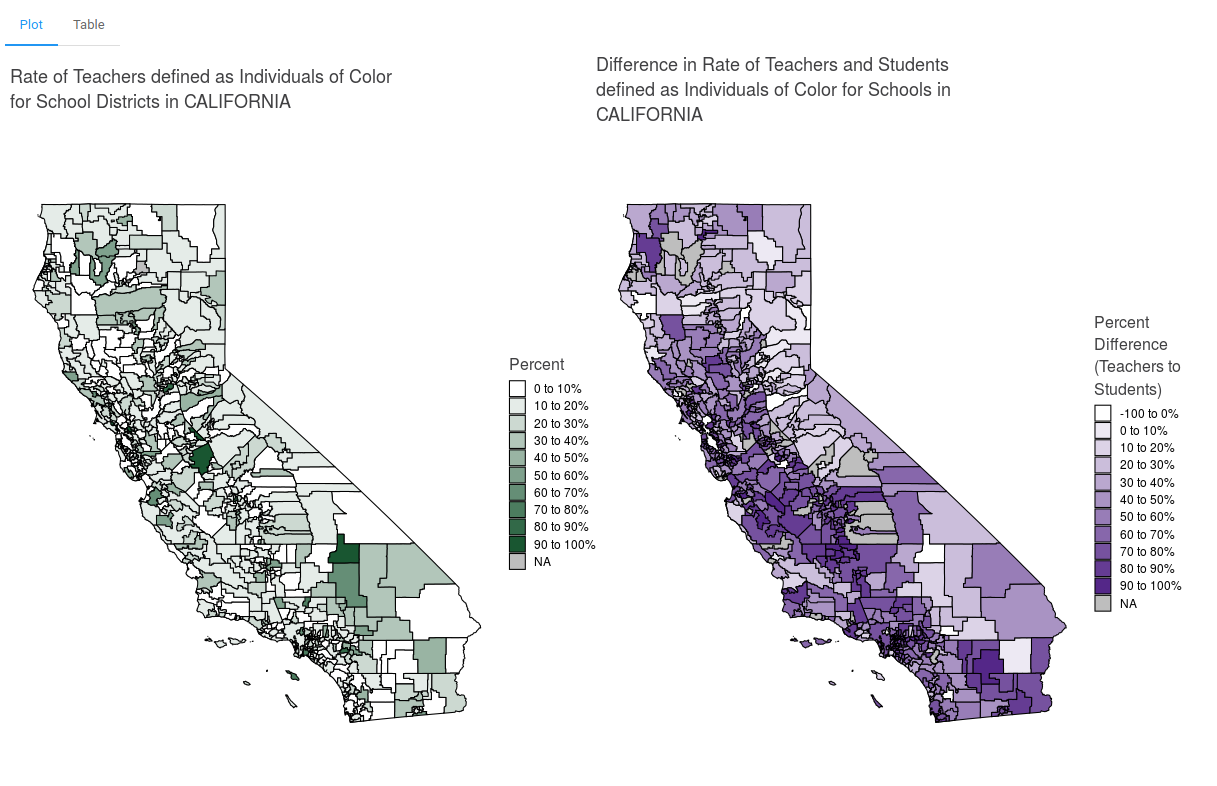
Insights on Diversifying the Educator Workforce - Teacher Diversity Tool
Use this free, user friendly shiny application to identify and visualize diversity gaps in states and school districts.
Shiny
R
research
education
data
2019
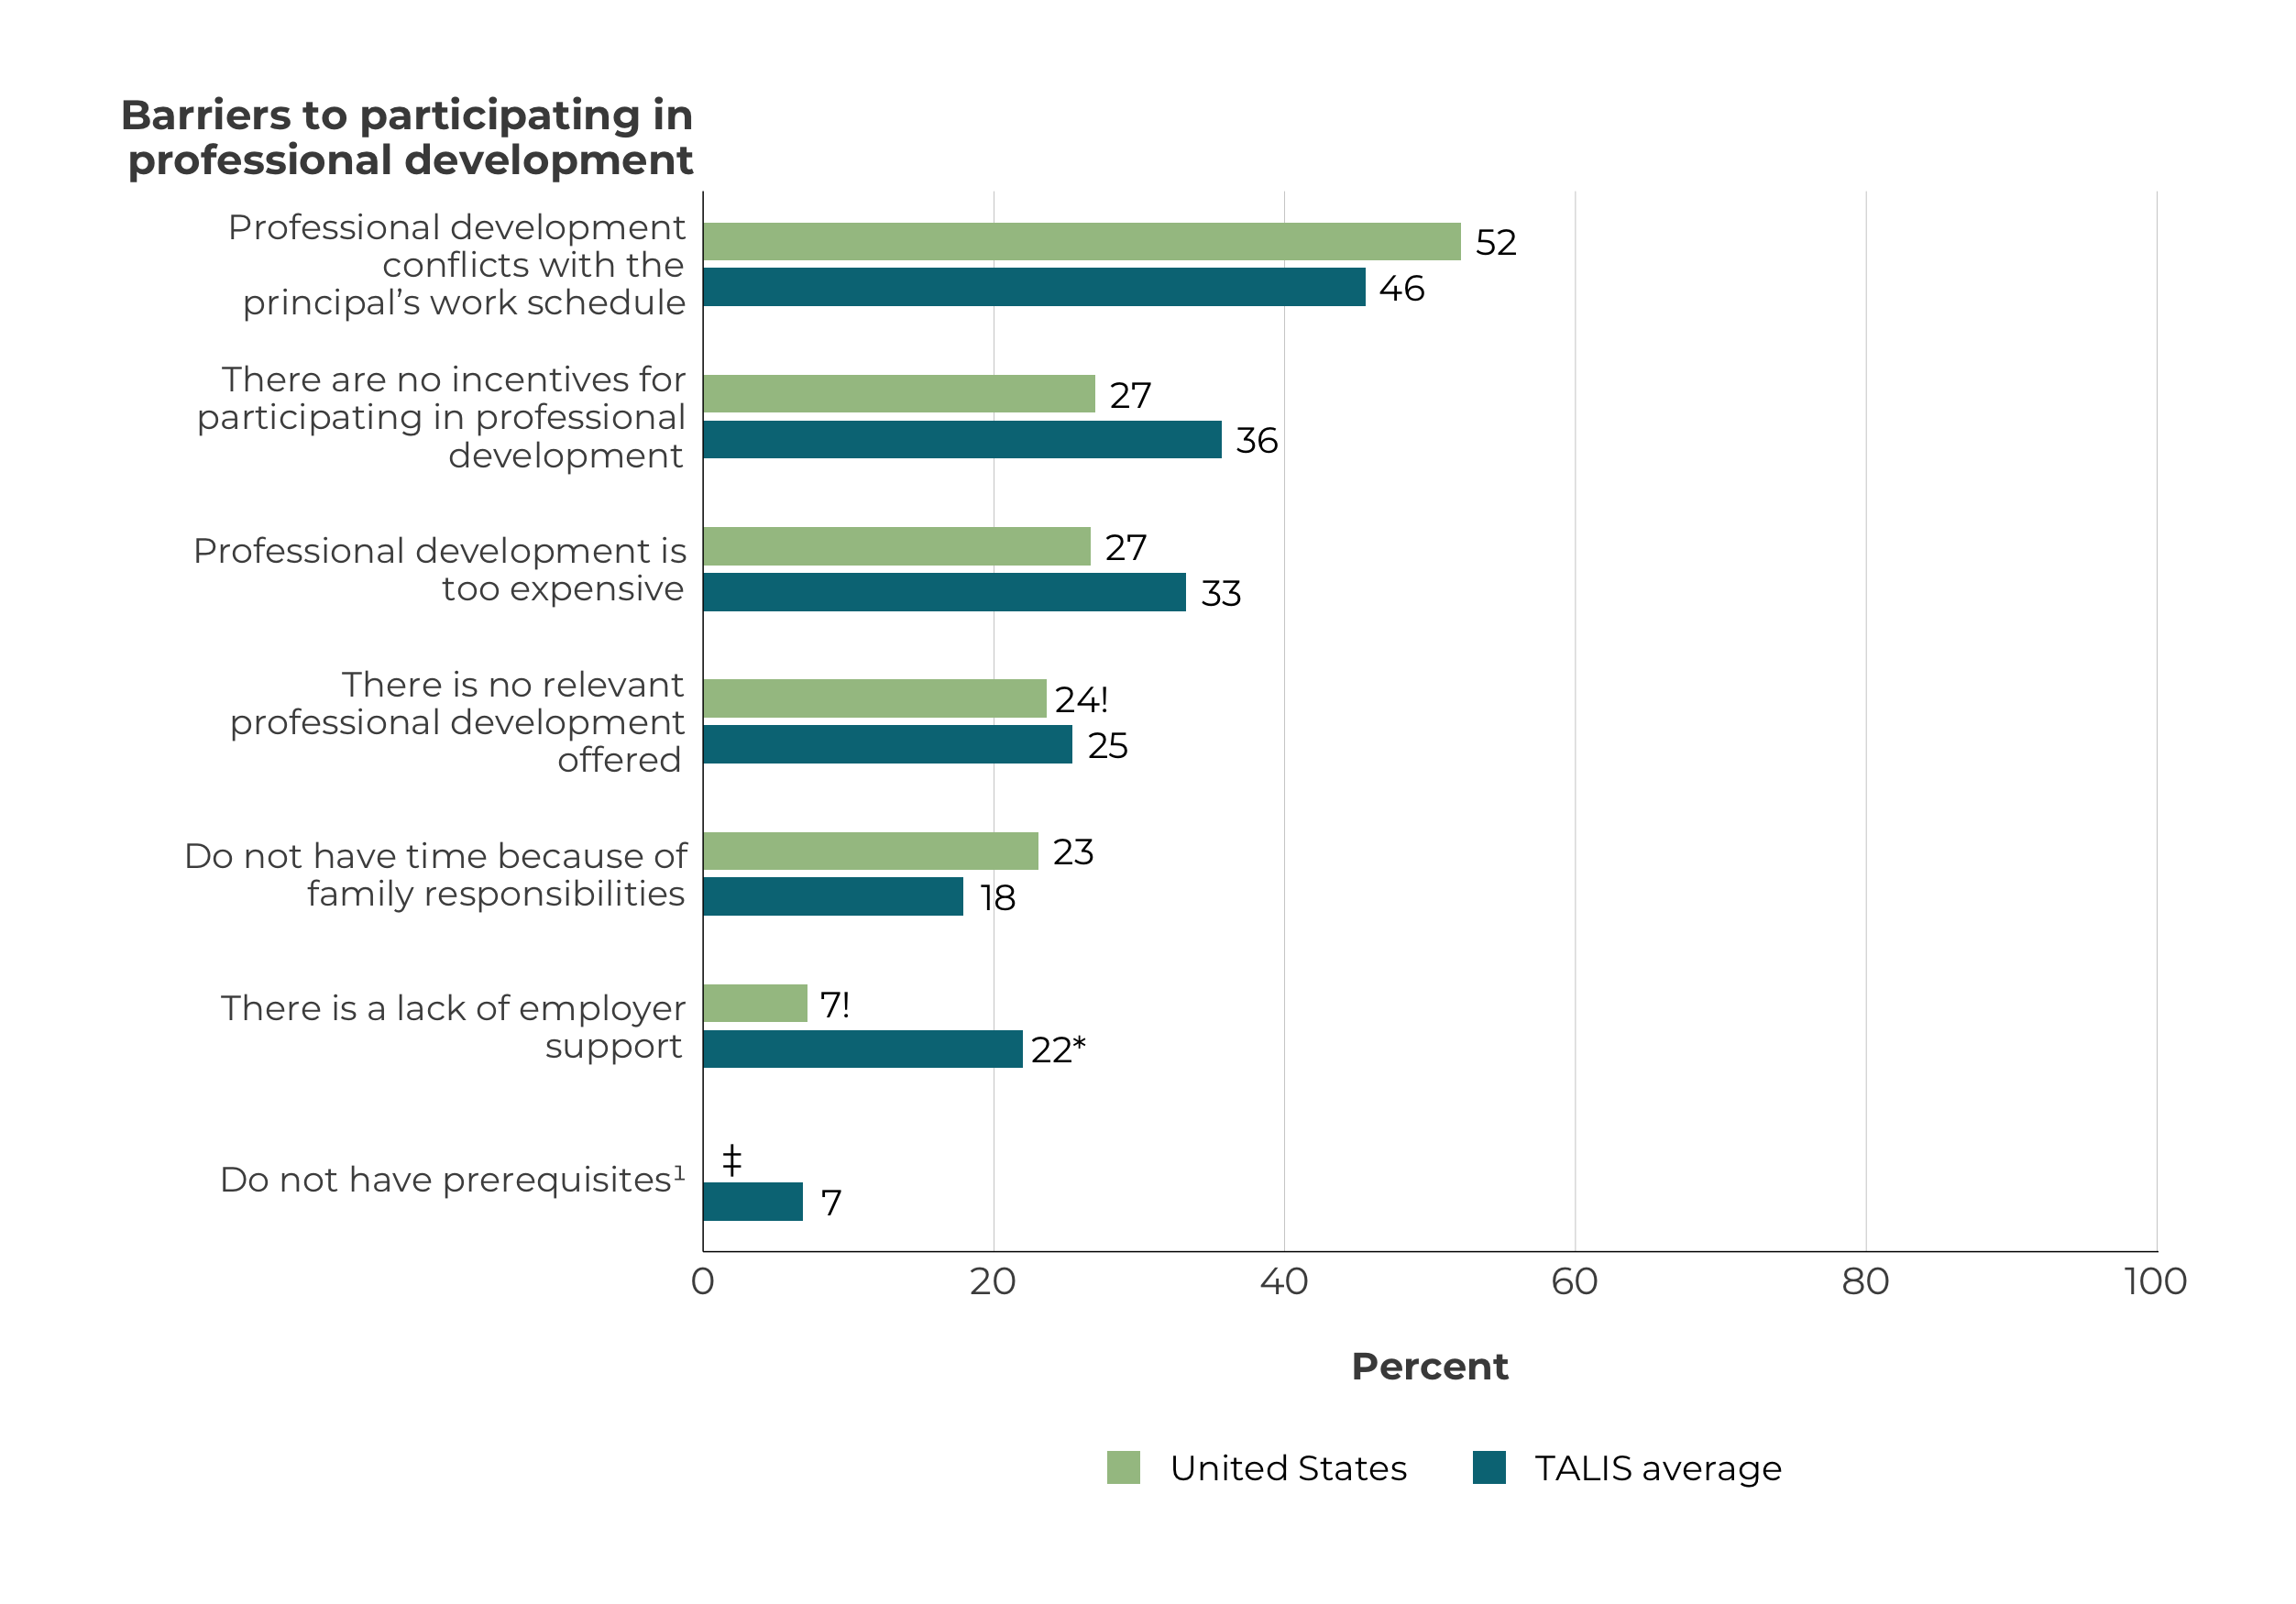
International Activities Program Highlights
Explore how US 8th grade students computer and information literacy and computational thinking compared internationally in 2018.
D3
R
research
education
data
talis
iap
2018
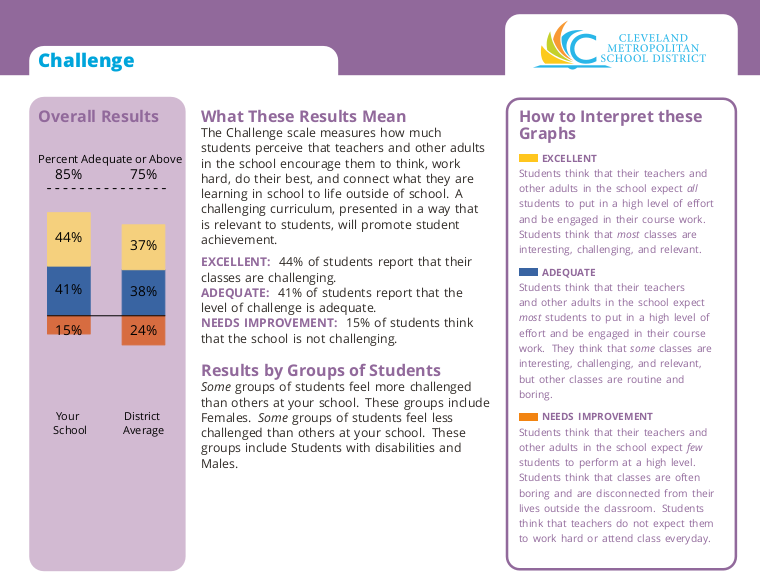
Automated Reports - Cleveland Metropolitan School District
Automate the production of over 400 reports embedded with customized text, tables, and visualizations.
LaTeX
R
ggplot2
education
automated reports
2018
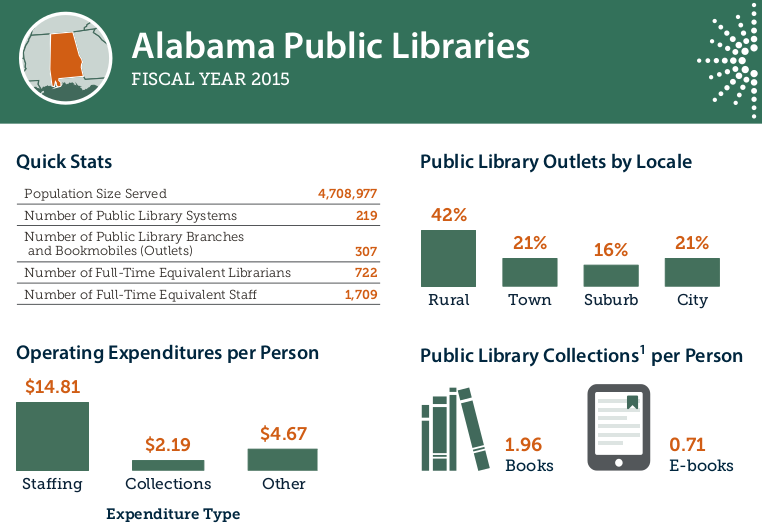
Automated Reports - IMLS, Public Libraries Survey
Automate the production of over 50 reports embedded with customized text, tables, and visualizations.
LaTeX
R
ggplot2
education
automated reports
2017
EdSurvey - R package (CRAN)
Processing and analysis of NCES large-scale education data with appropriate procedures.
R
research
education
data
2017
NAEPprimer - R package (CRAN)
Processing and analysis of NCES large-scale education data with appropriate procedures.
R
research
education
data
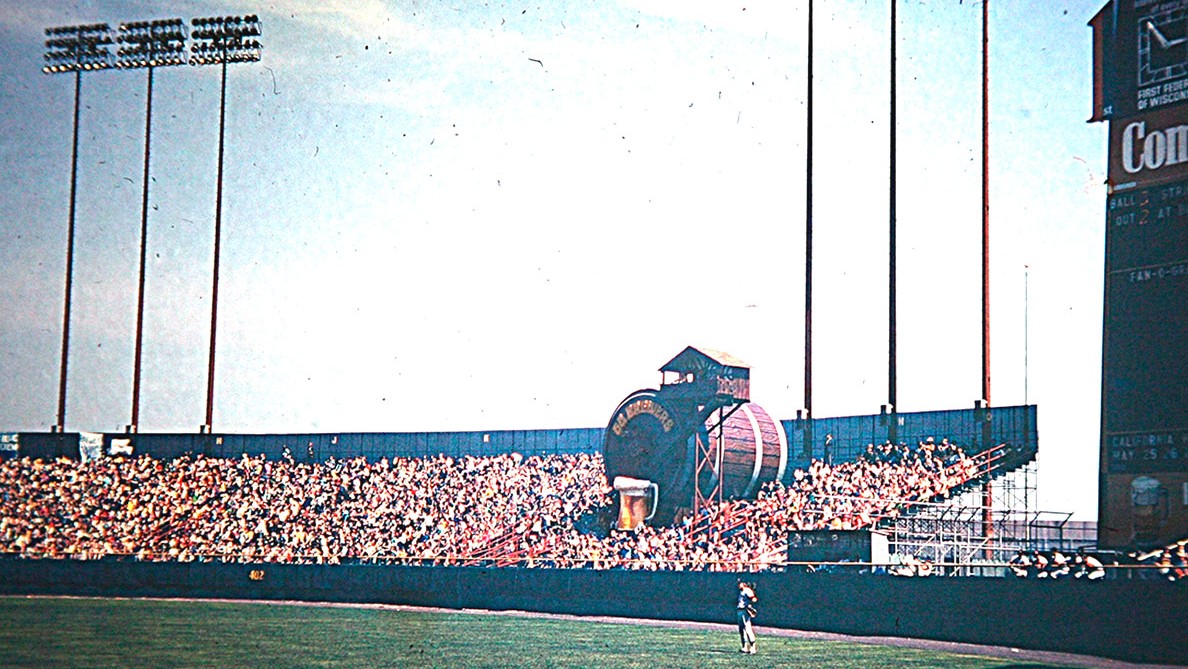
2016
sabr - R package (GitHub)
Connect to the Lahman SQL Database to query and calculate MLB offensive performance statistics
R
sabr
baseball
data